


By Anna Stetsenko, Founder and CEO of Indigo Tech Recruiters and .GIDNI Executive Search
Indigo Tech Recruiters and .GIDNI Executive Search have completed their seventh annual study of C-level compensation in Ukrainian IT. This year, 210 executives answered 42 questions covering salary, bonuses, motivation, career decisions, and their outlook on the market.
A special thank-you to our general partner, the Kharkiv IT Cluster, and to the distribution partners who helped us reach a sample of this scale: People First Club, Voitos AI, CleverStaff, O-CMO, Product & Growth Community, Growth Factory, and Product Management Community.
A few words on method. This is a purposive/convenience sample of executives connected to the Indigo, .GIDNI, and partner IT-community networks. All figures are self-reported by participants and are not a cross-section of the entire market. That is why we deliberately say "according to study participants" rather than "the market shows," and we flag any group smaller than 10 (N<10) as “indicative” — meaning the figure shows a tendency but is not statistically reliable: on a sample that small, even a single response noticeably affects the result.
One clarification up front. This year we deliberately shifted the focus of the headline figure to base monthly salary (net), excluding bonuses. This decision came at the request of our clients and the executives themselves: base salary is the number an employer enters into an offer, and the number a candidate names as their expectation. It is the most honest shared reference point for negotiation, and that is why it anchors this year's report. So the headline figure ($5,800) is salary, not total annual income (salary plus all actual payouts), which we calculate separately. If you remember last year's "$7,400 median," that was a different metric (salary plus bonuses).
$5,800 net per month: the median fixed salary of an IT executive in 2026
According to the Indigo Tech Recruiters and .GIDNI Executive Search study (N=210), the median fixed monthly salary of a C-level executive in Ukrainian IT in 2026 is $5,800 net.
A note on scope: $5,800 is a whole-market reference point, not a benchmark for any single role. The salary range for a specific position should be read by role (see the table below). In the coming weeks we will publish dedicated breakdowns for each: CEO, COO, CTO, CMO, CHRO, CPO, and CFO.
The median monthly salary of C-level executives in IT in 2026 is $5,800 net USD. The distribution around it:
- P25 (lower quartile): $4,000
- Median: $5,800
- P75 (upper quartile): $8,000
- P90 (top 10%): $10,950
- Mean: $6,428
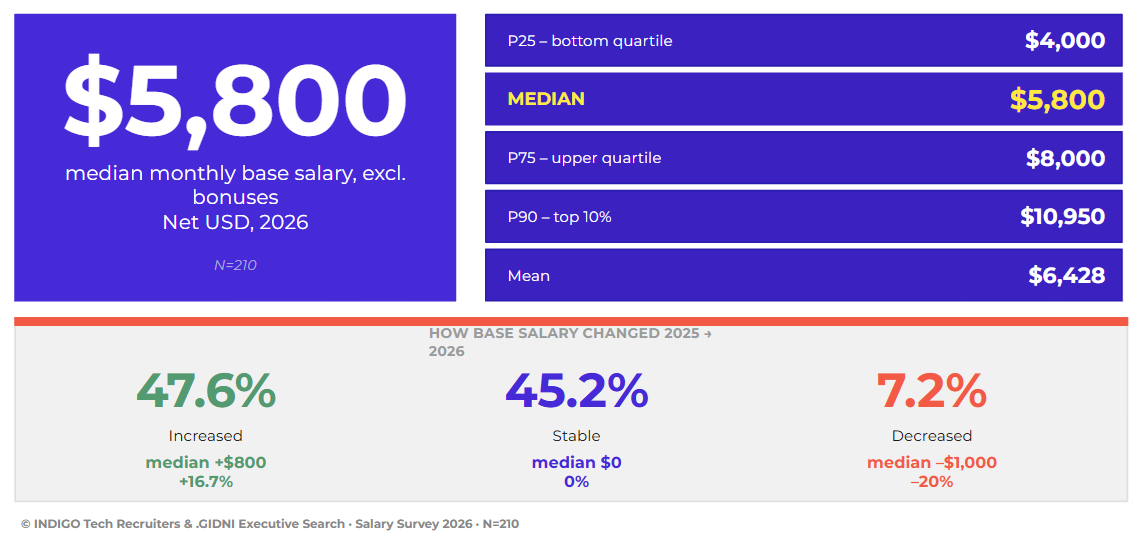 Fig. 1 — Median and salary distribution, 2026
How to read the year-over-year picture correctly
The obvious move is to compare $5,800 with last year's $6,000 and conclude that pay "dropped." That would be a mistake, and the reason is methodological.
Each year is a separate, independent sample with a different composition of participants: a different mix of roles, gender, and company types. So the aggregate median from one year to the next is not a panel that tracks the same people; it is two different snapshots. Over the long run, that kind of snapshot is reliable: $3,500 in 2018 rose to $5,800 in 2026, a +66% increase over eight years (2020 and 2023 had no study, due to COVID-19 and the full-scale invasion). Year-to-year swings of a few percent, however, sit within the noise of sample composition, so building a narrative on them is not sound.
The question "is pay rising or falling?" should be put not to the aggregate but to the same respondents: how their own rate changed over the year. Here the picture is unambiguous:
- 47.6% raised their rate (median +$800, or +16.7%)
- 45.2% stayed flat
- only 7.2% saw a decrease (median −$1,000)
Raises outnumber cuts by nearly seven to one. In other words, at the level of individual people the trend is growth, even as the aggregate median holds steady.
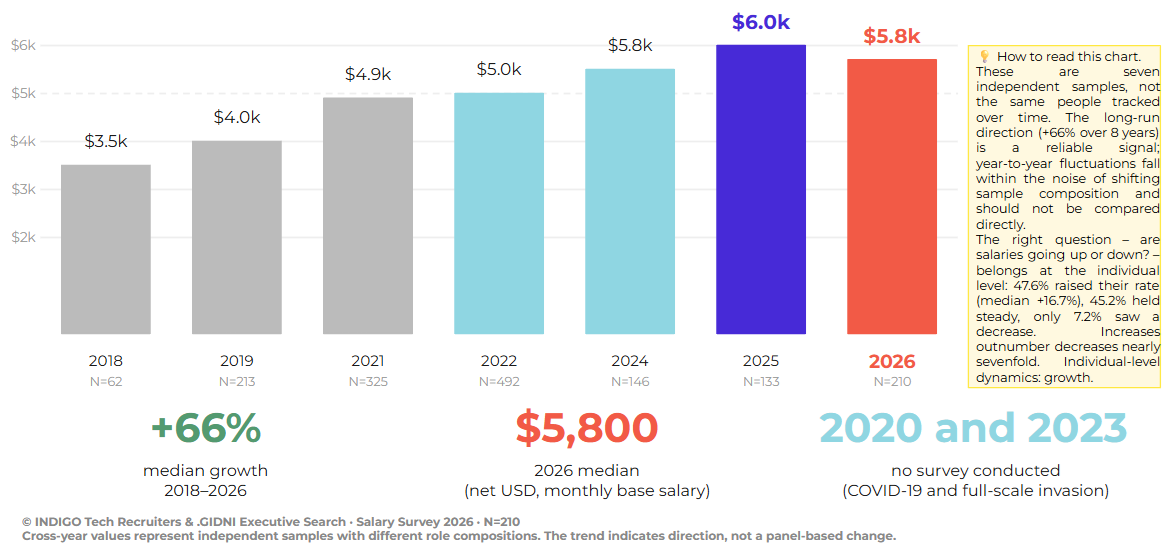 Fig. 2 — Cross-year trend in median salary, 2018–2026
A note on comparing with 2025. Last year's public headline ($7,400) counted salary plus bonuses (total income), whereas this year's ($5,800) is base salary. These are different metrics, so the direct comparison $7,400 → $5,800 does not mean a "decline": the difference is primarily that this year we lead with salary. If we compare income to income, the median total annual income for 2025 in this sample is roughly $6,480/month. Any residual difference from last year's figure reflects a different independent sample and refined role-grouping methodology this year. It is indicative, not a panel track.
What roles pay in 2026
The gap between roles is far wider than any year-over-year movement. Median salary by role for 2026:
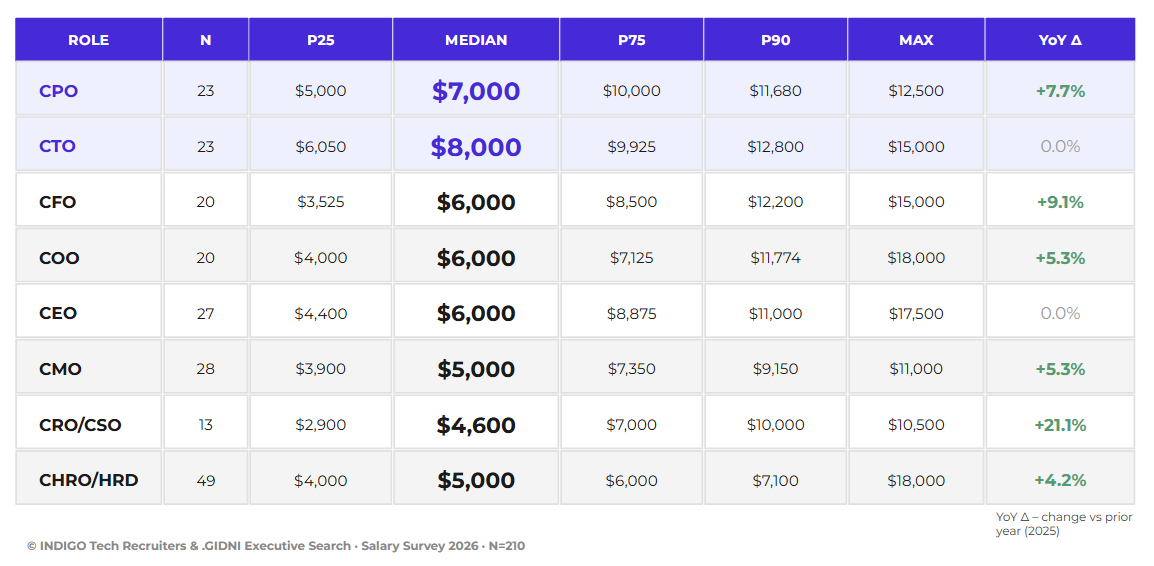 Fig. 3 — Salary by role, 2026
Two observations stand out. CRO/CSO posted the largest year-over-year jump (+21.1%): demand for executives directly responsible for revenue is recovering. And the CTO, the leader in absolute terms ($8,000), held flat over the year — the ceiling for this highly paid technical role appears to have been reached.
Total income in 2025: salary plus bonuses
Salary is the current rate. But an executive's real income is also shaped by bonuses, so for a complete picture we calculate total annual income separately. One important detail: these figures refer to actual income for 2025 (salary plus all bonuses actually paid out), whereas the median salary above is the current 2026 rate. These are different points in time, so they should be read side by side, not by subtraction.
The median total annual income for 2025 came to $77,800 (N=207), or roughly $6,480/month. The lower quartile is $54,000, the upper quartile is $115,000, and the top 10% of executives earned more than $150,000 a year. The calculated annual bonus had a median of about $6,600: two-thirds of participants (67%) received a bonus of more than $1,000, while one-third received nothing or a token amount.
The most interesting picture emerges by role, because bonuses noticeably reshuffle the ranking compared with base salary alone:
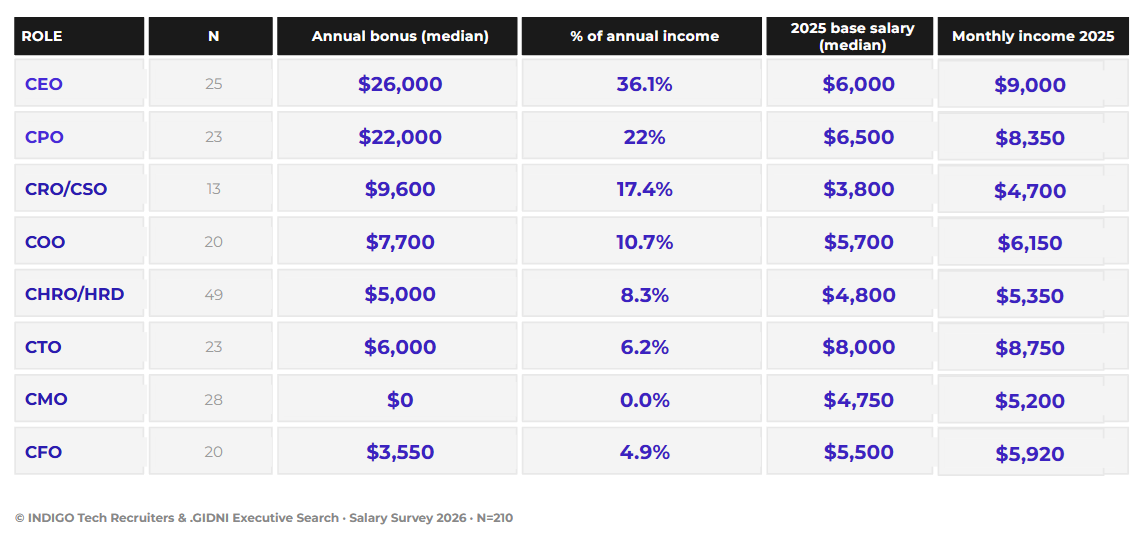 Fig. 4.1 — Monthly income of CxOs in 2025
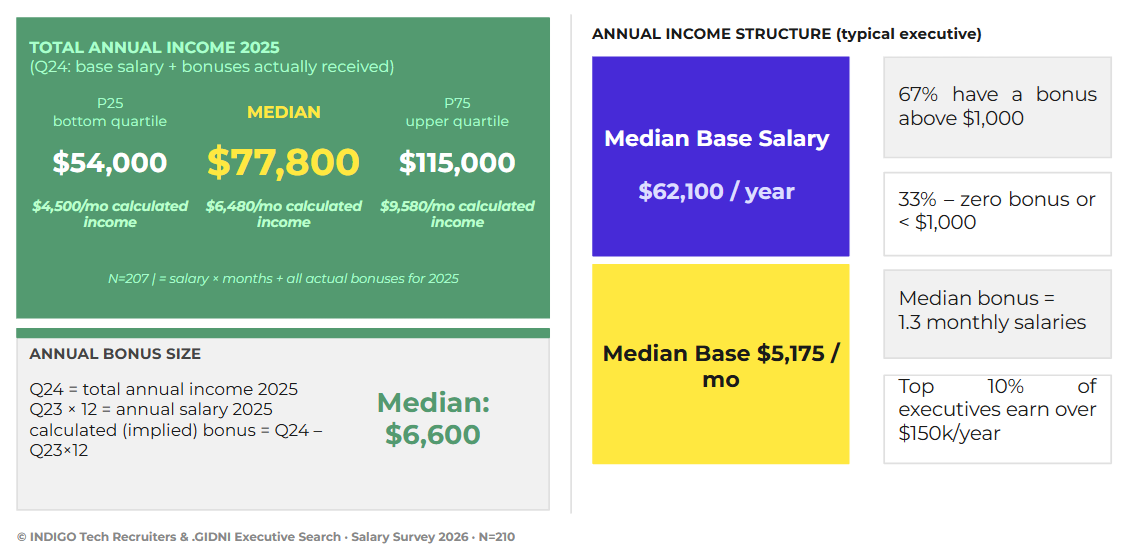 Fig. 4.2 — Monthly income of CxOs in 2025
The logic is simple: on base salary the market is led by the CTO, but on total income the CEO comes out ahead. The reason is the bonus: for CEOs it reaches 36% of annual income ($26,000), and for CPOs 22% ($22,000). CTOs, by contrast, have a high base but a modest variable component (6.2%), while CMOs work with effectively no bonus at the median. In other words, the economics of executive and product roles live in the bonus.
What really drives pay: the company matters more than tenure
In short: where you work matters more than how many years you have behind you. A company's structural characteristics turned out to be stronger predictors of salary than an executive's personal characteristics.
The strongest statistical relationship comes from company annual revenue (r=0.35, p<0.001). Executives at companies with revenue of $100M+ have a median of $7,250 — 142% higher than at companies under $1M ($3,000). Next, in order of influence:
- Product vs. outsourcing: product companies pay +44% more ($6,500 vs. $4,500 median). This has been a stable trend since 2021.
- Venture funding: VC/PE-backed companies pay +48% ($7,500 vs. $5,075 at bootstrapped companies).
- Foreign headquarters: +32% to the median, regardless of where the executive physically lives.
Age, meanwhile, is statistically insignificant (p>0.05), education shows only indicative differences, and experience correlates weakly (r=0.20). In other words, the career choice of company (type, capital, jurisdiction) influences compensation more than years on a résumé.
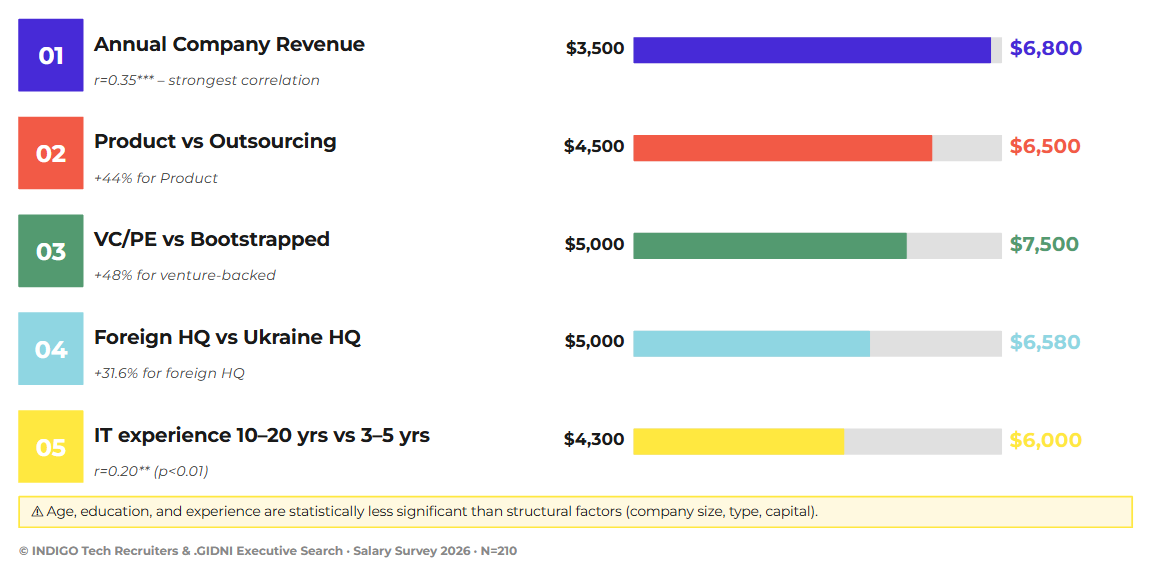 Fig. 5 — Factors that determine salary
At the intersection of these factors a "golden profile" emerges: product plus venture capital plus foreign headquarters yields a median of $10,000 (indicative, N=11), versus $4,500 for outsourcing on its own capital with a Ukrainian headquarters. A difference of +122%.
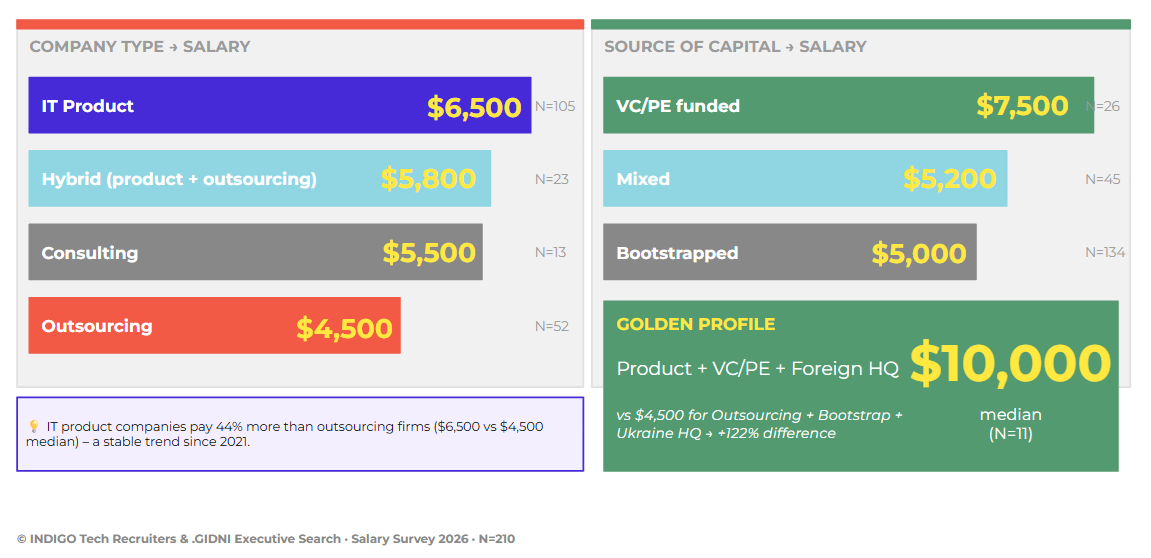 Fig. 6 — The "golden" CxO profile
A separate word on the foreign headquarters, because it is a practical takeaway for owners. Executives who live in Ukraine but work for a company with a foreign headquarters earn a median of $6,000 — 29% more than under a Ukrainian headquarters ($4,650). The same pattern holds among those living abroad ($7,000 vs. $5,600). Put simply: the country where a company is incorporated and headquartered affects executive pay no less than the role itself. For executives themselves, this is a practical guide: when evaluating an offer, factor in not only the role and company size but also where the company is registered — jurisdiction significantly affects the compensation ceiling.
Two paradoxes: the founder and the CPO
The founder paradox. Hired CEOs have a median salary of $7,750/month, 55% higher than the salary of founder-CEOs ($5,000). At first glance, founders appear to be underpaid. But if you look at total annual income for 2025 (salary plus all bonuses actually received), the medians almost converge: $108,000 for founders (N=15) versus $110,500 for hired CEOs (N=10). The gap is within the margin of error. Founders deliberately keep a low fixed salary and even out their income through the variable component: bonuses, dividends, or other payouts. The exact nature of this compensation cannot be identified from the available data.
The CPO phenomenon. This is the most dynamic role of recent years: +75% to the median salary over five years ($4,000 in 2021 vs. $7,000 in 2026). At the same time, the CPO is one of the hardest roles to poach: a high share of variable compensation (a calculated bonus of about $22,000/year, or 22% of total income) and a demand for equity as a key motivator. A telling detail: there is parity between founder-CPOs and hired CPOs — both groups show the same median of $7,000.
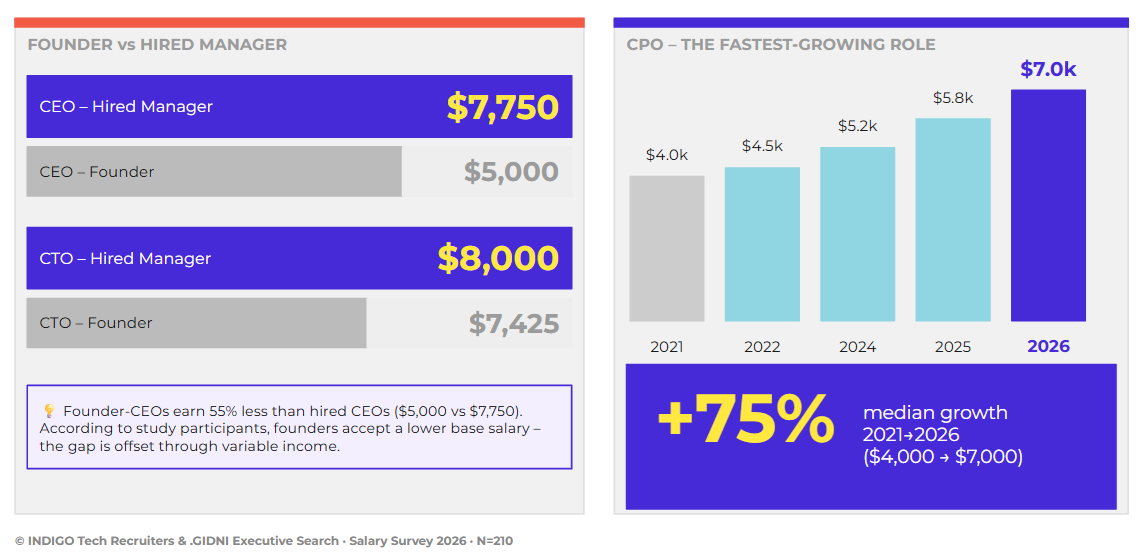 Fig. 7 — Two paradoxes: the founder and the CPO
One in three executives still has no bonus
The compensation structure of Ukrainian C-level remains predominantly fixed. 66% of executives receive 80%+ of their income as salary, and 36% work on a purely fixed rate with no variable component at all. A predominantly variable structure (variable-dominant, more than 50% bonus) is held by just 7.6%. For comparison: at large public companies in developed markets, base salary is often a smaller part of an executive’s package, with the main weight shifted toward long-term incentives such as stock, options, and PSUs. That said, this comparison is conditional: it refers to public corporations, whereas the Ukrainian sample is predominantly private and bootstrapped companies — for which a higher share of cash compensation is typical even in global markets.
A telling nuance: the median salary of those who do have a variable component ($6,000–$6,100) is higher than the median of those on a purely fixed rate ($5,500). That is, a pay-for-performance culture correlates with a generally higher level of compensation, rather than with a "bonus instead of salary" logic.
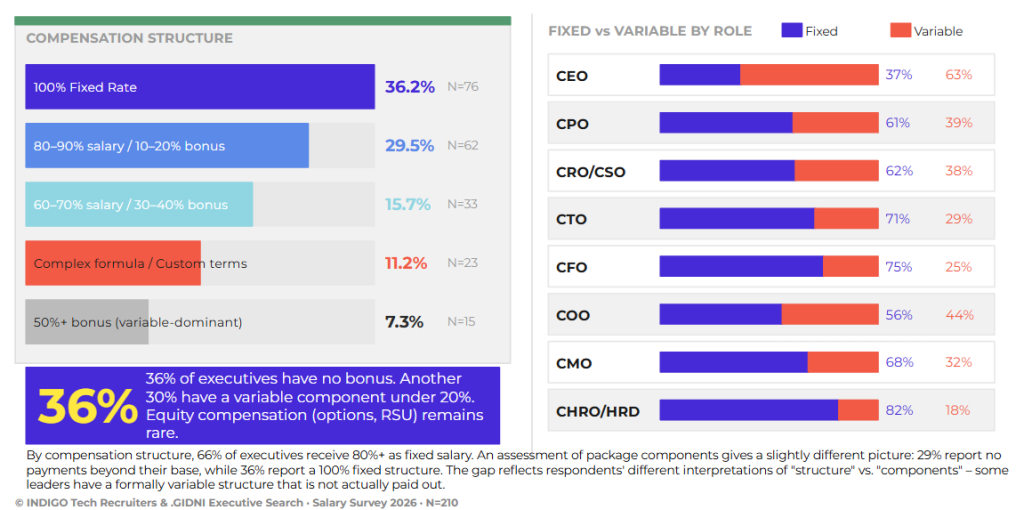 Fig. 8 — Compensation structure: fixed vs. variable
For completeness: total annual income for 2025 (Q24) has a median of $77,800, of which the calculated annual bonus has a median of about $6,600. At the top end, CEOs stand out the most: their median annual bonus is $26,000, or 36.1% of total income.
Loyalty doesn't pay financially
This is one of the study's most striking findings, and the one carried in the headline.
Executives with less than 1 year of tenure at a company saw a median rate increase of +8.3% over the year, and 55% received a raise. Executives with 5+ years of tenure had a median YoY of 0%: only 38% received a raise, while the remaining 62% are on the same rate as a year ago.
The conclusion is direct: the market re-prices compensation at the moment of a move, not by accumulating it inside a company over time.
It is also worth noting that 59.5% of participants themselves consider 3–5 years in one position to be a "healthy" tenure, while 40.5% have in fact stayed in their current role longer. The reasons may differ from person to person: stability in wartime, satisfaction with the role, loyalty to the team. The data records the fact, not the motivation, so we do not impose an explanation.
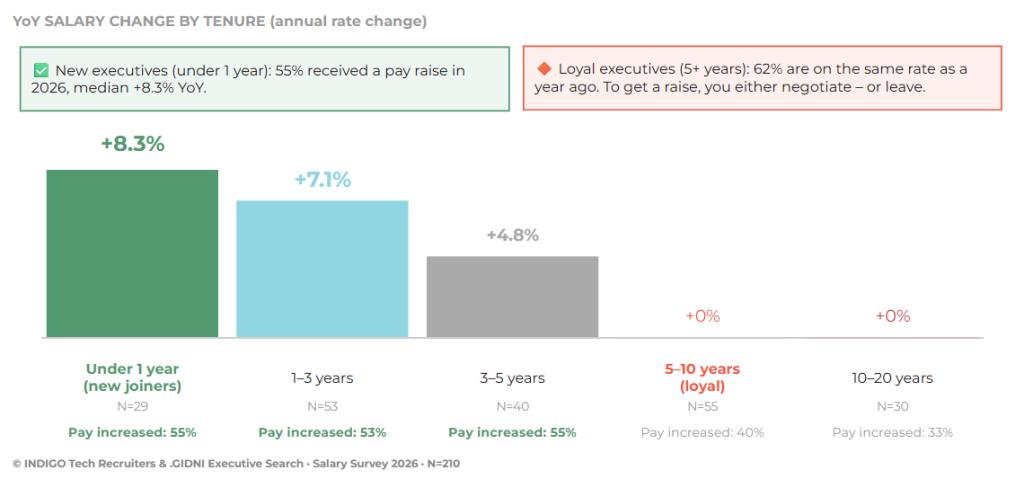 Fig. 9 — Year-over-year salary change by tenure
They leave over values, not money
The most valuable part of the study is the answer to what truly drives executives. When we asked why executives leave a company, the leading reason was not salary:
- A mismatch in values or culture: 43.8%
- A search for larger challenges: 26.2%
- Financial instability of the company: 24.8%
- Unsatisfactory compensation: only 19.5%
In other words, executives leave over values 2.3 times more often than over money. For owners and boards, this means something simple: competitive pay is a necessary but insufficient condition for retention. Cultural misalignment is the greater risk factor.
The same shows up in what motivates a new offer: scope of impact and autonomy are motivator #1 (71.9%), ahead of the size of salary and bonuses (66.2%).
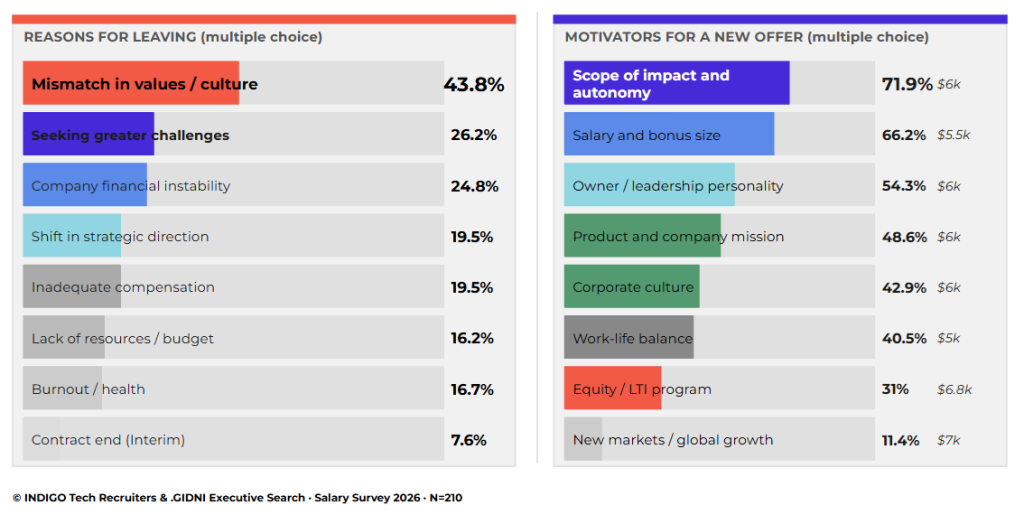 Fig. 10 — Reasons for leaving and motivators for a new offer
And work finds executives on its own: 69.5% rely on passive search (inbound offers), and 62.4% on networking and referrals. The vast majority of C-level openings are never published publicly.
The salary uplift threshold: a reference point, not a budget
A common assumption when searching for executives is that the market median is the target figure for an offer. The data shows that this approach systematically underestimates the budget.
The median reflects the current level of pay for a position, but it does not account for the salary uplift threshold — the increase at which a candidate is willing to consider a change of role. According to participants, this threshold is a median of +20–30% over the current package, and for passive candidates who are not looking for work (70% of the sample) it is higher.
The takeaway for employers is straightforward: the reference point for a hiring budget should not be the market median, but the current income of the specific candidate plus the salary uplift. That is why we studied this metric more closely this year — it directly determines both the realism of an offer and the length of the search.
The gender gap: structural, not "for the same role"
This year we treat the gender topic more precisely than before. The C-level compensation gap is primarily structural in nature: women are concentrated in the lowest-paid CxO role (CHRO/HRD, median $5,000) and absent from the highest (CTO, 0% women in the sample). The difference is therefore formed primarily at the level of role distribution, not pay for the same work.
An important nuance: “structural” does not mean “non-gendered.” The fact that women cluster in “humanities-oriented” functions while men cluster in technical ones, and that the former are generally paid less, is itself a gendered phenomenon — one that takes shape long before the C-level: through access to technical education, role models, caregiving expectations, and the cultural undervaluation of “women’s” work. Our data captures the result of this process, but not its causes. That is why we make neither the claim “this is pay discrimination” nor “this is simply free choice” — both statements go beyond what the sample shows.
And now about the limits of what we can claim. Within roles, the picture is mixed: of the 6 roles where both genders are represented, the median is higher for men in 4 and for women in 2 (CMO and COO). A reliable conclusion about a within-role gap is not possible: the only role where both gender groups exceed the N≥10 threshold is CMO, and there the women's median is in fact higher ($5,250 vs. $4,750). In the remaining roles at least one gender group falls below the threshold, so within-role differences are indicative, not statistical.
The bottom line, without overstatement: we see structural inequality clearly, and it is real. We do not rule out a direct gender factor "for the same role," but the available data is insufficient for a statistically reliable claim. That is precisely why it matters to us that next year at least 300 executives, women and men, join the study (our target for 2027): a larger sample will let us not only form hypotheses but draw statistically reliable conclusions for each role.
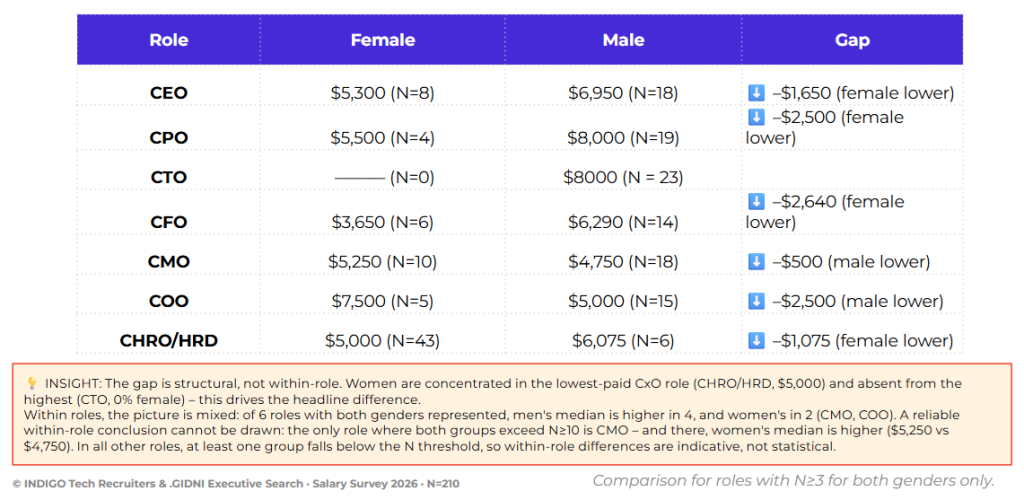 Fig. 11 — Women executives earn less because of role, not gender
AI as an ally, but a cautious business outlook
Contrary to alarmist headlines, Ukrainian executives see AI as a tool, not a threat. 70% say AI optimizes operating costs, 63% that it speeds up decision-making, and only 5.8% see it as a threat to their own skills. The role most integrated with AI (AI-enabled) is the CMO.
An interesting nuance: despite this intense penetration of AI into executives’ work and the ambition of many businesses to become AI-first companies, AI is practically absent as a standalone C-level role. Only one Chief AI Officer (CAIO) took part in the study. In other words, AI is for now embedded into existing functions rather than carved out as a separate position — and the emergence of the CAIO as a standalone role is likely still ahead.
At the same time, the business-climate outlook for the next 12 months is restrained: only 17% are optimists, 59% expect the situation to remain stable, and 24% are pessimistic. Pessimism is highest among CFOs (40%, the highest figure), and optimism among CPOs (30%).
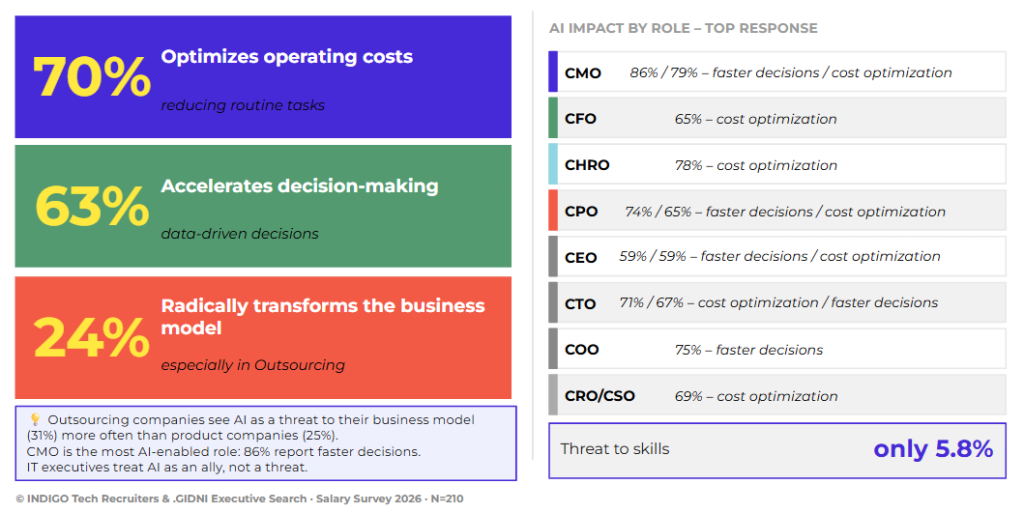 Fig. 12.1 — The impact of AI and the business-climate outlook
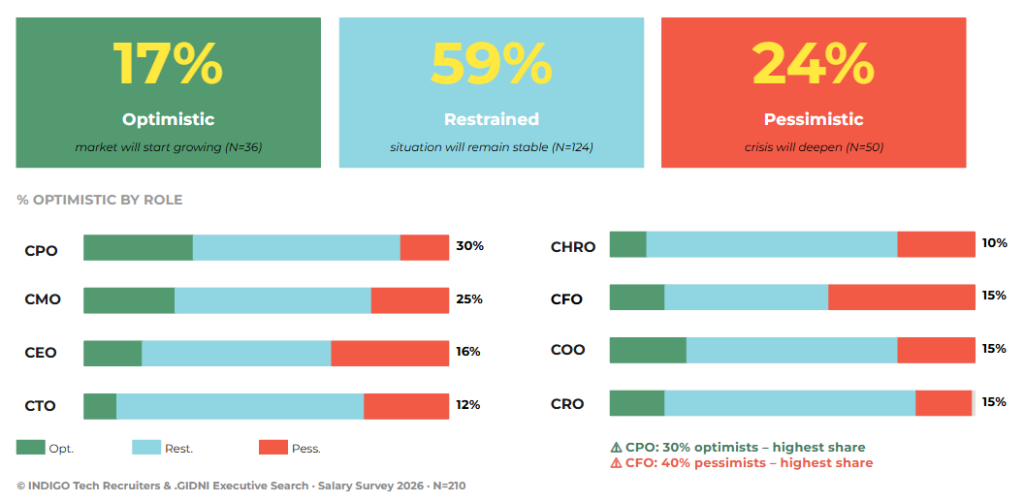 Fig. 12.2 — The impact of AI and the business-climate outlook
What to do with this
For business owners:
- The greatest risk of an unmanaged executive departure is not pay, but a mismatch in values (44% vs. 19.5%). A regular strategic dialogue with the leadership team costs the business far less than searching for and onboarding a new executive.
- Loyal executives (5+ years) have a median YoY of 0%. A proactive retention offer is more cost-effective than a full hiring cycle for a new executive.
- The median threshold for considering an external offer is +20–30% over the current package, and it is higher for passive candidates. Assess the competitiveness of an offer by total income, not by base rate alone.
For executives:
- The market re-prices compensation at the moment of a move, not for length of service. If your rate has not changed in several years, that is a systemic market pattern, not an assessment of your work.
- Look at the whole structure, not just the salary: one in three executives in the sample has no bonus at all. A "good rate" without a variable component and equity can lose to a more modest salary with a real bonus. Ask about the structure, not a single number.
- A company's jurisdiction matters more than your place of residence: a foreign headquarters adds +32% regardless of where you live.
- Autonomy correlates with satisfaction more strongly than the size of the package. When evaluating an offer, find out the real level of independence in decision-making, not just the figure.
This study is the voice of the Ukrainian IT C-Level community, and its accuracy depends directly on how many people take part. Thank you to everyone who answered the survey and shared it, and once again to our general partner, the Kharkiv IT Cluster, and to all our distribution partners.
Figures are in USD, net. Results are based on self-reported data from participants and are not statistically representative of the entire population. Recommendations are based on the Indigo Salary Survey 2026 (N=210) and do not constitute individual advice.
The full report (48 slides, with every breakdown by role, factor, and career) is available here.
Want to be among the first to receive the 2027 study, or to discuss an executive search for your role? Write to us.


 Success!